Find the convex hull of a set of points.
Arguments
- pts
A matrix with a point in each row.
- addRays
Add the ray defined by
direction.- useRGLBBox
Use the RGL bounding box when add rays.
- direction
Ray direction. If i'th entry is positive, consider the i'th column of
ptsplus a value greater than on equal zero (minimize objective $i$). If negative, consider the i'th column ofptsminus a value greater than on equal zero (maximize objective $i$).- tol
Tolerance on standard deviation if using PCA.
- m
Minimum values of the bounding box.
- M
Maximum values of the bounding box.
Value
A list with hull equal a matrix with row indices of the vertices defining each
facet in the hull and pts equal the input points (and dummy points) and columns:
pt, true if a point in the original input; false if a dummy point (a point on a ray).
vtx, TRUE if a vertex in the hull.
Examples
## 1D
pts<-matrix(c(1,2,3), ncol = 1, byrow = TRUE)
dimFace(pts) # a line
#> [1] 1
convexHull(pts)
#> $hull
#> [,1] [,2]
#> [1,] 1 3
#>
#> $pts
#> p1 pt vtx
#> 1 1 1 TRUE
#> 2 2 1 FALSE
#> 3 3 1 TRUE
#>
convexHull(pts, addRays = TRUE)
#> $hull
#> [,1] [,2]
#> [1,] 1 4
#>
#> $pts
#> p1 pt vtx
#> 1 1 1 TRUE
#> 2 2 1 FALSE
#> 3 3 1 FALSE
#> 21 8 0 TRUE
#>
## 2D
pts<-matrix(c(1,1, 2,2), ncol = 2, byrow = TRUE)
dimFace(pts) # a line
#> [1] 1
convexHull(pts)
#> $hull
#> [,1] [,2]
#> [1,] 1 2
#>
#> $pts
#> p1 p2 pt vtx
#> 1 1 1 1 TRUE
#> 2 2 2 1 TRUE
#>
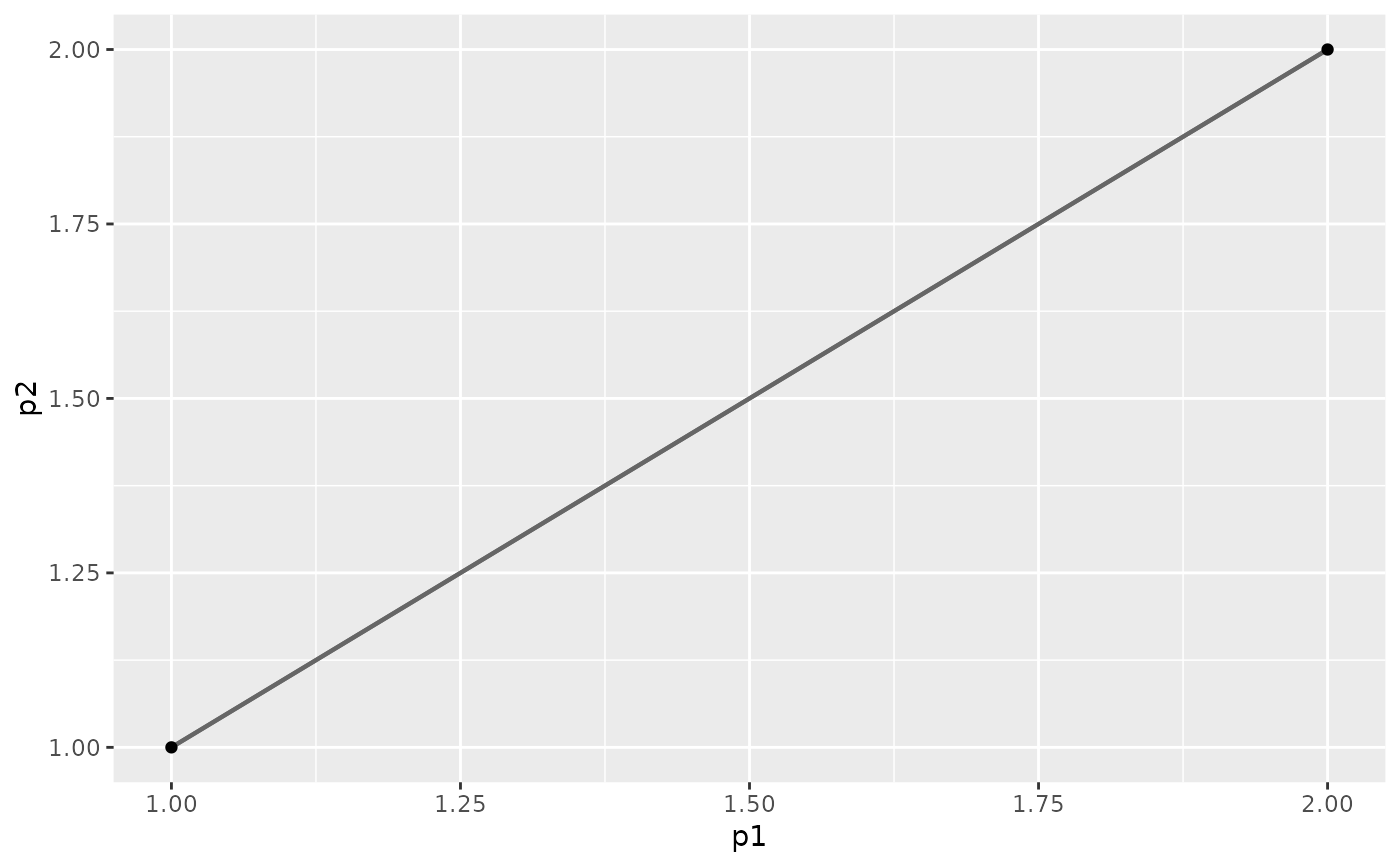
plotHull2D(pts, drawPoints = TRUE)
#> Warning: `aes_string()` was deprecated in ggplot2 3.0.0.
#> ℹ Please use tidy evaluation idioms with `aes()`.
#> ℹ See also `vignette("ggplot2-in-packages")` for more information.
#> ℹ The deprecated feature was likely used in the gMOIP package.
#> Please report the issue at <https://github.com/relund/gMOIP/issues>.
#> Warning: Using `size` aesthetic for lines was deprecated in ggplot2 3.4.0.
#> ℹ Please use `linewidth` instead.
#> ℹ The deprecated feature was likely used in the gMOIP package.
#> Please report the issue at <https://github.com/relund/gMOIP/issues>.
 convexHull(pts, addRays = TRUE)
#> $hull
#> [,1] [,2] [,3] [,4]
#> [1,] 3 1 4 5
#>
#> $pts
#> p1 p2 pt vtx
#> 1 1 1 1 TRUE
#> 2 2 2 1 FALSE
#> 21 7 1 0 TRUE
#> 3 1 7 0 TRUE
#> 4 7 7 0 TRUE
#>
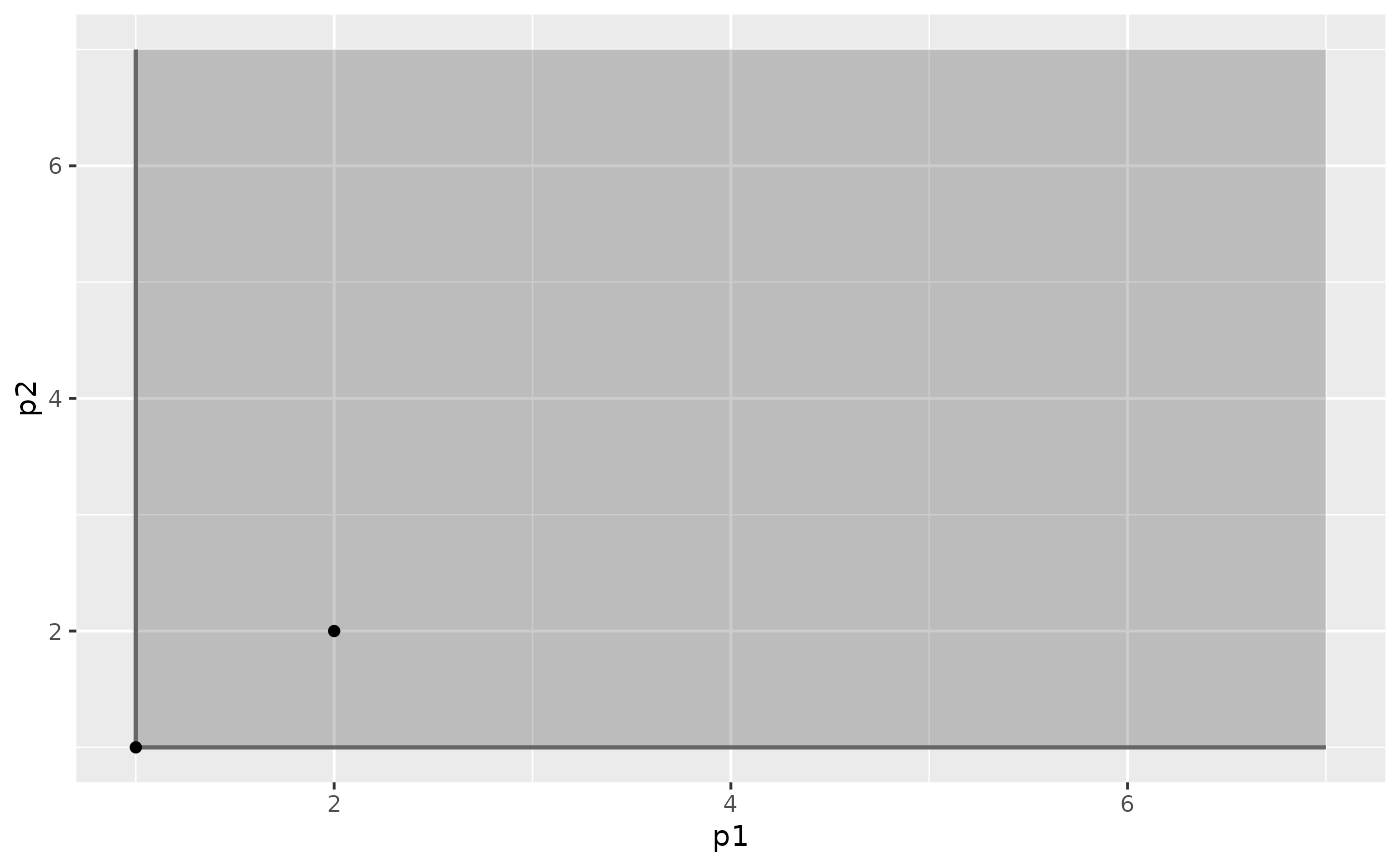
plotHull2D(pts, addRays = TRUE, drawPoints = TRUE)
 pts<-matrix(c(1,1, 2,2, 0,1), ncol = 2, byrow = TRUE)
dimFace(pts) # a polygon
#> [1] 2
convexHull(pts)
#> $hull
#> [,1] [,2] [,3]
#> [1,] 1 3 2
#>
#> $pts
#> p1 p2 pt vtx
#> 1 1 1 1 TRUE
#> 2 2 2 1 TRUE
#> 3 0 1 1 TRUE
#>
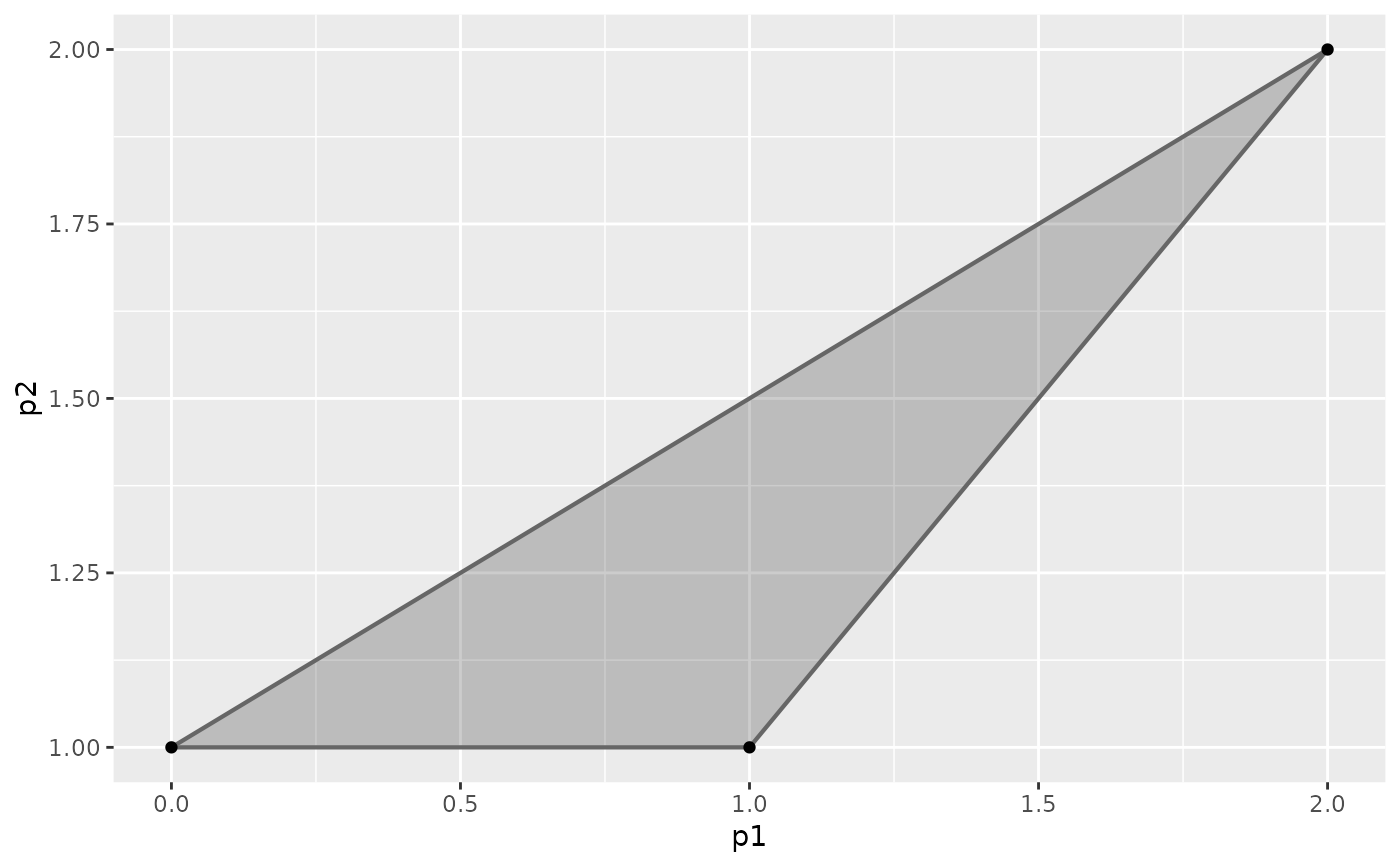
plotHull2D(pts, drawPoints = TRUE)
 convexHull(pts, addRays = TRUE, direction = c(-1,1))
#> $hull
#> [,1] [,2] [,3] [,4] [,5]
#> [1,] 2 1 4 5 6
#>
#> $pts
#> p1 p2 pt vtx
#> 1 1 1 1 TRUE
#> 2 2 2 1 TRUE
#> 3 0 1 1 FALSE
#> 21 -5 1 0 TRUE
#> 4 -5 7 0 TRUE
#> 32 2 7 0 TRUE
#>
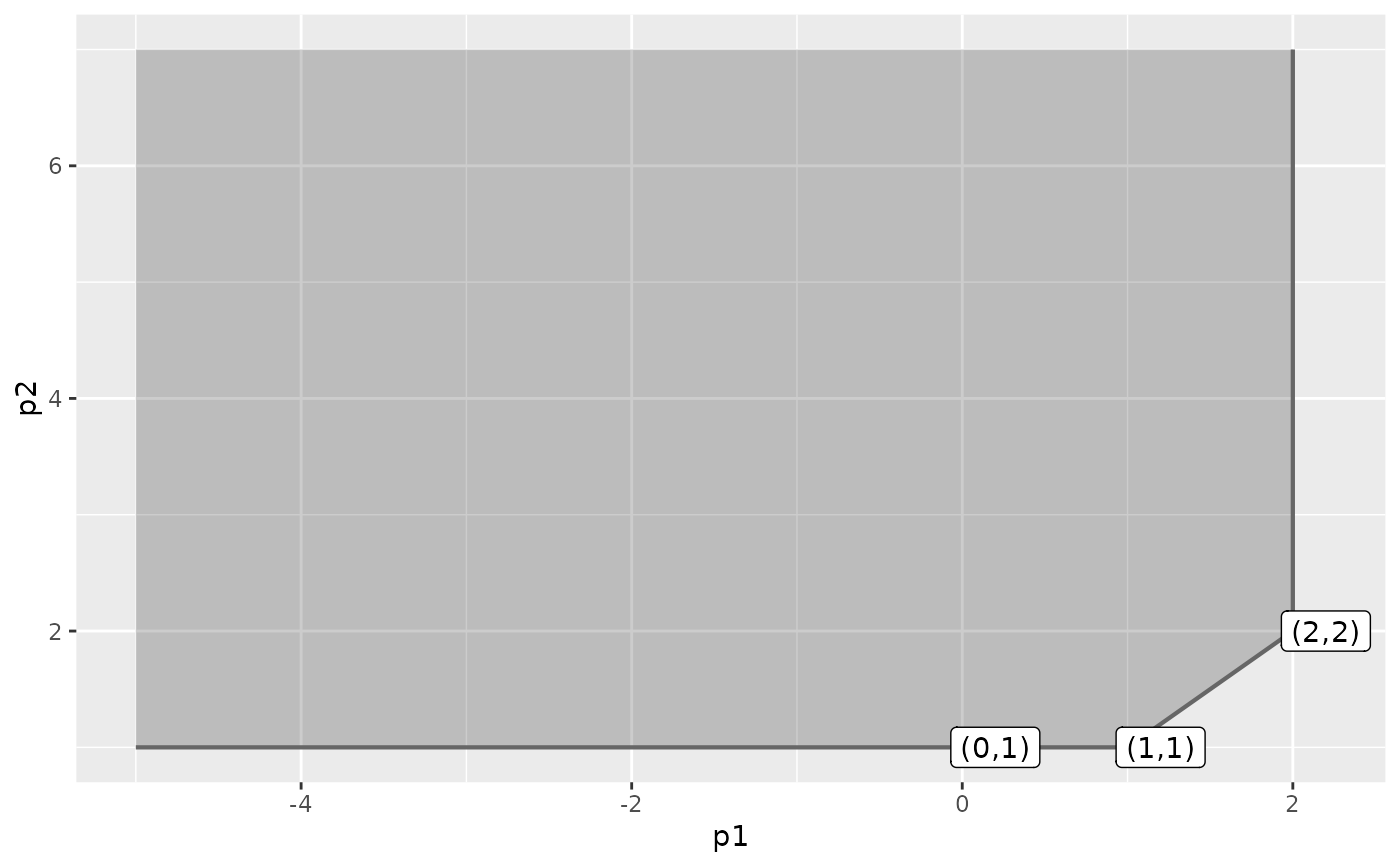
plotHull2D(pts, addRays = TRUE, direction = c(-1,1), addText = "coord")
 ## 3D
pts<-matrix(c(1,1,1), ncol = 3, byrow = TRUE)
dimFace(pts) # a point
#> [1] 0
convexHull(pts)
#> $hull
#> [,1]
#> [1,] 1
#>
#> $pts
#> p1 p2 p3 pt vtx
#> 1 1 1 1 1 TRUE
#>
pts<-matrix(c(0,0,0,1,1,1,2,2,2,3,3,3), ncol = 3, byrow = TRUE)
dimFace(pts) # a line
#> [1] 1
convexHull(pts)
#> $hull
#> [,1] [,2]
#> [1,] 1 4
#>
#> $pts
#> p1 p2 p3 pt vtx
#> 1 0 0 0 1 TRUE
#> 2 1 1 1 1 FALSE
#> 3 2 2 2 1 FALSE
#> 4 3 3 3 1 TRUE
#>
pts<-matrix(c(0,0,0,0,1,1,0,2,2,0,0,2), ncol = 3, byrow = TRUE)
dimFace(pts) # a polygon
#> [1] 2
convexHull(pts)
#> $hull
#> [,1] [,2] [,3]
#> [1,] 1 4 3
#>
#> $pts
#> p1 p2 p3 pt vtx
#> 1 0 0 0 1 TRUE
#> 2 0 1 1 1 FALSE
#> 3 0 2 2 1 TRUE
#> 4 0 0 2 1 TRUE
#>
convexHull(pts, addRays = TRUE)
#> $hull
#> [,1] [,2] [,3] [,4]
#> [1,] 7 6 5 1
#> [2,] 9 8 5 1
#> [3,] 9 7 11 5
#> [4,] 10 8 6 1
#> [5,] 10 7 11 6
#> [6,] 10 9 11 8
#>
#> $pts
#> p1 p2 p3 pt vtx
#> 1 0 0 0 1 TRUE
#> 2 0 1 1 1 FALSE
#> 3 0 2 2 1 FALSE
#> 4 0 0 2 1 FALSE
#> 21 5 0 0 0 TRUE
#> 31 0 7 0 0 TRUE
#> 41 5 7 0 0 TRUE
#> 5 0 0 7 0 TRUE
#> 6 5 0 7 0 TRUE
#> 7 0 7 7 0 TRUE
#> 8 5 7 7 0 TRUE
#>
pts<-matrix(c(1,0,0,1,1,1,1,2,2,3,1,1), ncol = 3, byrow = TRUE)
dimFace(pts) # a polygon
#> [1] 2
convexHull(pts) # a polyhedron
#> $hull
#> [,1] [,2] [,3]
#> [1,] 1 3 4
#>
#> $pts
#> p1 p2 p3 pt vtx
#> 1 1 0 0 1 TRUE
#> 2 1 1 1 1 FALSE
#> 3 1 2 2 1 TRUE
#> 4 3 1 1 1 TRUE
#>
pts<-matrix(c(1,1,1,2,2,1,2,1,1,1,1,2), ncol = 3, byrow = TRUE)
dimFace(pts) # a polytope (polyhedron)
#> [1] 3
convexHull(pts)
#> $hull
#> [,1] [,2] [,3]
#> [1,] 3 2 1
#> [2,] 4 2 1
#> [3,] 4 3 1
#> [4,] 4 3 2
#> attr(,"convhulln")
#> <pointer: 0x558d371e8430>
#>
#> $pts
#> p1 p2 p3 pt vtx
#> 1 1 1 1 1 TRUE
#> 2 2 2 1 1 TRUE
#> 3 2 1 1 1 TRUE
#> 4 1 1 2 1 TRUE
#>
ini3D(argsPlot3d = list(xlim = c(0,3), ylim = c(0,3), zlim = c(0,3)))
pts<-matrix(c(1,1,1,2,2,1,2,1,1,1,1,2), ncol = 3, byrow = TRUE)
plotPoints3D(pts)
plotHull3D(pts, argsPolygon3d = list(color = "red"))
convexHull(pts)
#> $hull
#> [,1] [,2] [,3]
#> [1,] 3 2 1
#> [2,] 4 2 1
#> [3,] 4 3 1
#> [4,] 4 3 2
#> attr(,"convhulln")
#> <pointer: 0x558d3ae52f80>
#>
#> $pts
#> p1 p2 p3 pt vtx
#> 1 1 1 1 1 TRUE
#> 2 2 2 1 1 TRUE
#> 3 2 1 1 1 TRUE
#> 4 1 1 2 1 TRUE
#>
plotHull3D(pts, addRays = TRUE)
convexHull(pts, addRays = TRUE)
#> $hull
#> [,1] [,2] [,3] [,4]
#> [1,] 7 6 5 1
#> [2,] 9 8 5 1
#> [3,] 9 7 11 5
#> [4,] 10 8 6 1
#> [5,] 10 7 11 6
#> [6,] 10 9 11 8
#>
#> $pts
#> p1 p2 p3 pt vtx
#> 1 1 1 1 1 TRUE
#> 2 2 2 1 1 FALSE
#> 3 2 1 1 1 FALSE
#> 4 1 1 2 1 FALSE
#> 21 7 1 1 0 TRUE
#> 31 1 7 1 0 TRUE
#> 41 7 7 1 0 TRUE
#> 5 1 1 7 0 TRUE
#> 6 7 1 7 0 TRUE
#> 7 1 7 7 0 TRUE
#> 8 7 7 7 0 TRUE
#>
finalize3D()
3D plot