Generate a sample of nondominated points.
Usage
genNDSet(
  p,
  n,
  range = c(1, 100),
  random = FALSE,
  sphere = TRUE,
  planes = FALSE,
  box = FALSE,
  keepDom = FALSE,
  crit = "min",
  dubND = FALSE,
  classify = FALSE,
  ...
)
Arguments
- p
Dimension of the points.
- n
Number nondominated points generated.
- range
The range of the points in each dimension (a vector or matrix with
prows).- random
Random sampling.
- sphere
Generate points on a sphere.
- planes
Generate points between two planes.
- box
Generate points in boxes.
- keepDom
Keep dominated points also.
- crit
Criteria used (a vector of min/max).
- dubND
Should duplicated non-dominated points be considered as non-dominated.
- classify
Non-dominated points are classified into supported extreme (
se), supported non-extreme (sne) and unsupported (us)- ...
Further arguments passed on to
genSample.
Examples
# \donttest{
## Random
range <- matrix(c(1,100, 50, 100, 10, 50), ncol = 2, byrow = TRUE)
pts <- genNDSet(3, 5, range = range, random = TRUE, keepDom = TRUE)
head(pts)
#> z1 z2 z3 nd
#> 1 33 100 46 FALSE
#> 2 86 80 34 FALSE
#> 3 13 92 28 FALSE
#> 4 81 100 48 FALSE
#> 5 78 50 45 TRUE
#> 6 56 53 43 TRUE
Rfast::colMinsMaxs(as.matrix(pts[, 1:3]))
#> [,1] [,2] [,3]
#> min 4 50 12
#> max 92 100 48
ini3D(FALSE, argsPlot3d = list(xlim = c(min(pts[,1])-2,max(pts[,1])+10),
ylim = c(min(pts[,2])-2,max(pts[,2])+10),
zlim = c(min(pts[,3])-2,max(pts[,3])+10)))
plotPoints3D(pts[,1:3])
plotPoints3D(pts[pts$nd,1:3], argsPlot3d = list(col = "red", size = 10))
plotCones3D(pts[pts$nd,1:3], argsPolygon3d = list(alpha = 1))
finalize3D()
3D plot
## Between planes
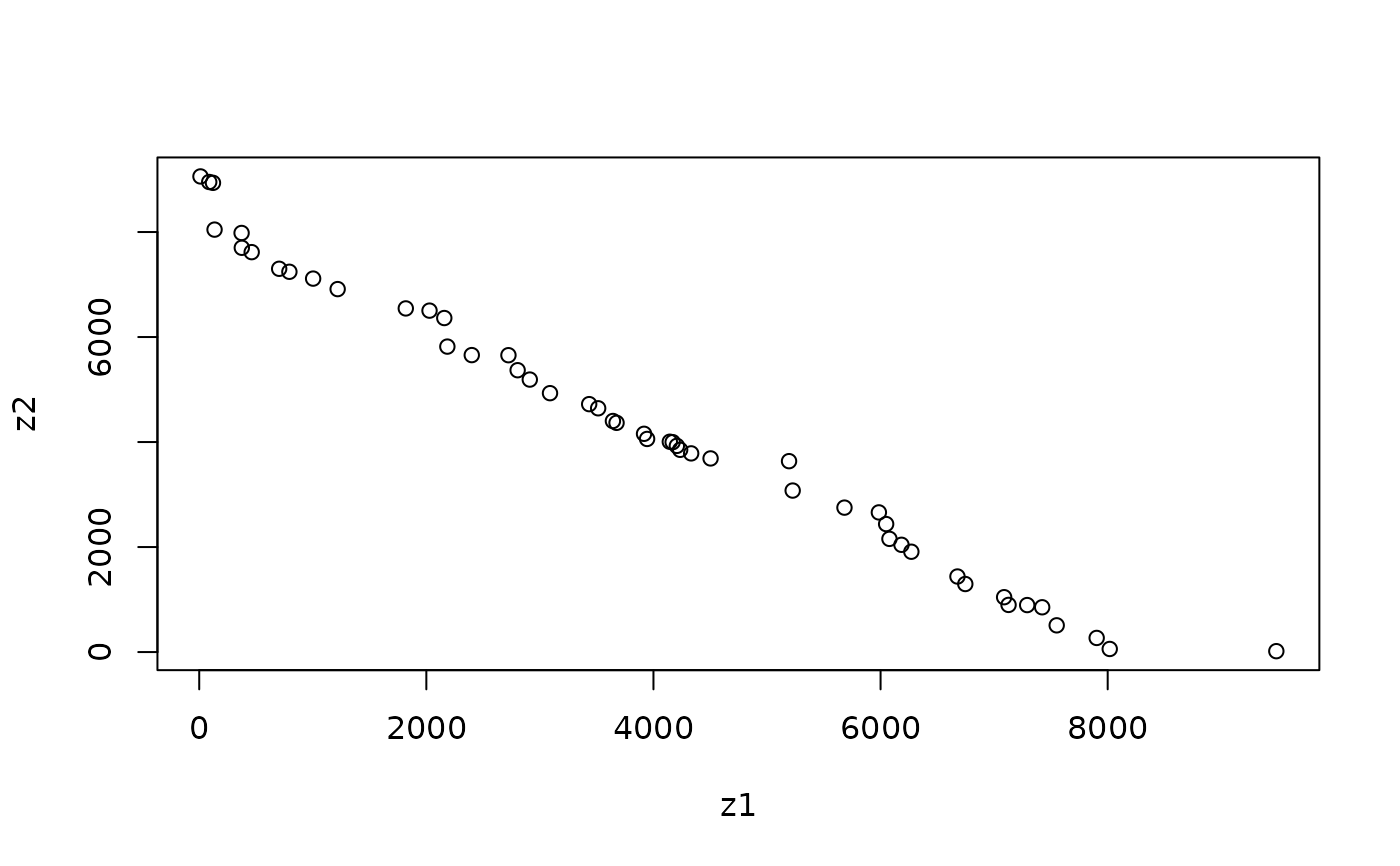
range <- matrix(c(1,10000, 1,10000), ncol = 2, byrow = TRUE)
pts <- genNDSet(2, 50, range = range, planes = TRUE, classify = TRUE)
head(pts)
#> z1 z2 nd se sne us cls
#> 1 5542 2974 TRUE FALSE FALSE TRUE us
#> 2 2228 6083 TRUE FALSE FALSE TRUE us
#> 3 1982 6355 TRUE FALSE FALSE TRUE us
#> 4 7423 853 TRUE FALSE FALSE TRUE us
#> 5 6517 1993 TRUE FALSE FALSE TRUE us
#> 6 552 7676 TRUE FALSE FALSE TRUE us
Rfast::colMinsMaxs(as.matrix(pts[, 1:2]))
#> [,1] [,2]
#> min 2 4
#> max 9907 8741
plot(pts[, 1:2])
 range <- matrix(c(1,100, 50,100, 10, 50), ncol = 2, byrow = TRUE)
center <- rowMeans(range)
planeU <- c(rep(1, 3), -1.2*sum(rowMeans(range)))
planeL <- c(rep(1, 3), -0.8*sum(rowMeans(range)))
pts <- genNDSet(3, 50, range = range, planes = TRUE, keepDom = TRUE, classify = TRUE,
argsPlanes = list(center = center, planeU = planeU, planeL = planeL))
head(pts)
#> z1 z2 z3 nd se sne us cls
#> 1 33 78 46 FALSE FALSE FALSE TRUE d
#> 2 63 64 17 FALSE FALSE FALSE TRUE d
#> 3 74 64 36 FALSE FALSE FALSE TRUE d
#> 4 43 81 15 FALSE FALSE FALSE TRUE d
#> 5 53 73 47 FALSE FALSE FALSE TRUE d
#> 6 35 68 42 FALSE FALSE FALSE TRUE d
Rfast::colMinsMaxs(as.matrix(pts[, 1:3]))
#> [,1] [,2] [,3]
#> min 1 51 10
#> max 99 100 50
ini3D(FALSE, argsPlot3d = list(xlim = c(min(pts[,1])-2,max(pts[,1])+10),
ylim = c(min(pts[,2])-2,max(pts[,2])+10),
zlim = c(min(pts[,3])-2,max(pts[,3])+10),
box = TRUE, axes = TRUE))
plotPoints3D(pts[,1:3])
plotPoints3D(pts[pts$nd,1:3], argsPlot3d = list(col = "red", size = 10))
rgl::planes3d(planeL[1], planeL[2], planeL[3], planeL[4], alpha = 0.5)
rgl::planes3d(planeU[1], planeU[2], planeU[3], planeU[4], alpha = 0.5)
3D plot
finalize3D()
## On a sphere
ini3D()
range <- c(1,100)
cent <- rep(range[1] + (range[2]-range[1])/2, 3)
pts <- genNDSet(3, 20, range = range, sphere = TRUE, keepDom = TRUE,
argsSphere = list(center = cent))
rgl::spheres3d(cent, radius=49.5, color = "grey100", alpha=0.1)
plotPoints3D(pts)
plotPoints3D(pts[pts$nd,], argsPlot3d = list(col = "red", size = 10))
rgl::planes3d(cent[1],cent[2],cent[3],-sum(cent^2), alpha = 0.5, col = "red")
3D plot
finalize3D()
ini3D()
cent <- c(100,100,100)
r <- 75
planeC <- c(cent+r/3)
planeC <- c(planeC, -sum(planeC^2))
pts <- genNDSet(3, 20, keepDom = TRUE,
argsSphere = list(center = cent, radius = r, below = FALSE, plane = planeC, factor = 6))
rgl::spheres3d(cent, radius=r, color = "grey100", alpha=0.1)
plotPoints3D(pts)
plotPoints3D(pts[pts$nd,], argsPlot3d = list(col = "red", size = 10))
rgl::planes3d(planeC[1],planeC[2],planeC[3],planeC[4], alpha = 0.5, col = "red")
3D plot
finalize3D()
3D plot
# }