The plot is created based on a grid (rows, cols). Each grid point is numbered from bottom to
top and left to right (starting from 1), i.e. given grid point with coordinates (r, c) (where
(1,1) is the top left corner and (rows, cols) is the bottom right corner) the grid id is `(c
rows + r`. You must assign a node to the hypergraph to a grid point (see below).
Usage
plot_hypergraph(
  hgf,
  grid_dim,
  show_grid = FALSE,
  radx = 0.03,
  rady = 0.05,
  cex = 1,
  mar_x = 0.035,
  mar_y = 0.15,
  draw_border = FALSE,
  action_offset = 0.025,
  trans_labels = "none",
  trans_label_cex = 0.8 * cex,
  trans_label_adj = c(0.5, -0.6),
  state_label = "label",
  action_label = "label",
  action_w_label = "none",
  action_color = c("", "label", "policy"),
  actions_visible = c("all", "policy"),
  connected_to = NULL,
  recalc_grid = FALSE,
  mdp = NULL,
  ...
)
Arguments
- hgf
A list with the hypergraph containing two data frames, normally found using
get_hypergraph(). The data framenodesmust have columns:s_id(state id),g_id(grid id) andlabel(node label). The data framehyperarcsmust have columnss_id(head node),trans(a list-column of tail node ids),pr(a list-column of transition probabilities),action_weights(a list-column of action weights),trans_weights(a list-column of transition-by-weight matrices),a_idx(action index),label(action label),lwd(hyperarc line width),lty(hyperarc line type) andcol(hyperarc color).- grid_dim
A 2-dim vector (rows, cols) representing the size of the grid.
- show_grid
If true show the grid points (good for debugging).
- radx
Horizontal radius of the box.
- rady
Vertical radius of the box.
- cex
Relative size of text.
- mar_x
Horizontal margin.
- mar_y
Vertical margin.
- draw_border
If
TRUE, draw a border around the plot region and report the outside and inside padding (good for debugging).- action_offset
Distance used to separate actions with the same start and trans states. Set to
0to draw overlapping actions.- trans_labels
Transition-label mode.
"none"draws no transition labels (the default);"custom"draws values from an optionaltrans_labelslist-column inhgf$hyperarcs; otherwise use a|-separated combination of"label","s_id","prob", and"weights", for example"prob|weights". The older"state"spelling is treated as"label".- trans_label_cex
Relative size of transition-label text.
- trans_label_adj
Position adjustment passed to
textempty()for transition labels, drawn at the middle of each split-to-transition branch.- state_label
What to plot in states.
"custom"uses astate_labelcolumn inhgf$nodes; otherwise use a|-separated combination of"label"(state label, default),"s_id"(state id),"s_idx"(stage-based state index), and"weight"(optimal weight of the state).- action_label
What to plot near the split. One of
"none","custom"(uses anaction_labelcolumn inhgf$hyperarcs), or a|-separated combination of"label"(action label, default) and"a_idx".- action_w_label
What to plot from the start state to the split. One of
"none"(default),"weight", or"custom"(uses anaction_w_labelcolumn inhgf$hyperarcs).- action_color
Action coloring scheme. Default
""uses black lines."label"uses different colors based on the action labels."policy"highlights the current policy.- actions_visible
Action visibility mode.
"all"(default) shows all actions."policy"only shows actions in the current policy.- connected_to
Optional vector of state ids. If supplied, plot only states reachable from these states by following visible hyperarcs forward, and trim hyperarcs and transition-level data to the remaining states.
- recalc_grid
If
TRUEandconnected_tois supplied, recalculate the grid for the visible nodes. Nodes keep their original columns, but visible nodes within each column are placed consecutively from the top and the number of grid rows is reduced to the maximum number of visible nodes in any column.- mdp
The MDP model. Required if
state_labelcontains"weight",action_color = "policy", oractions_visible = "policy".- ...
Graphical parameters passed to
textempty.
Examples
## Set working dir
wd <- setwd(system.file("models", package = "MDP2"))
#### A finite-horizon replacement problem ####
mdp<-load_mdp("machine1_")
#> Read binary files (0.00016249 sec.)
#> Build the HMDP (4.9412e-05 sec.)
#> Checking MDP and found no errors (1.562e-06 sec.)
plot(mdp)
 plot(mdp, action_color = "label") # colors based on labels
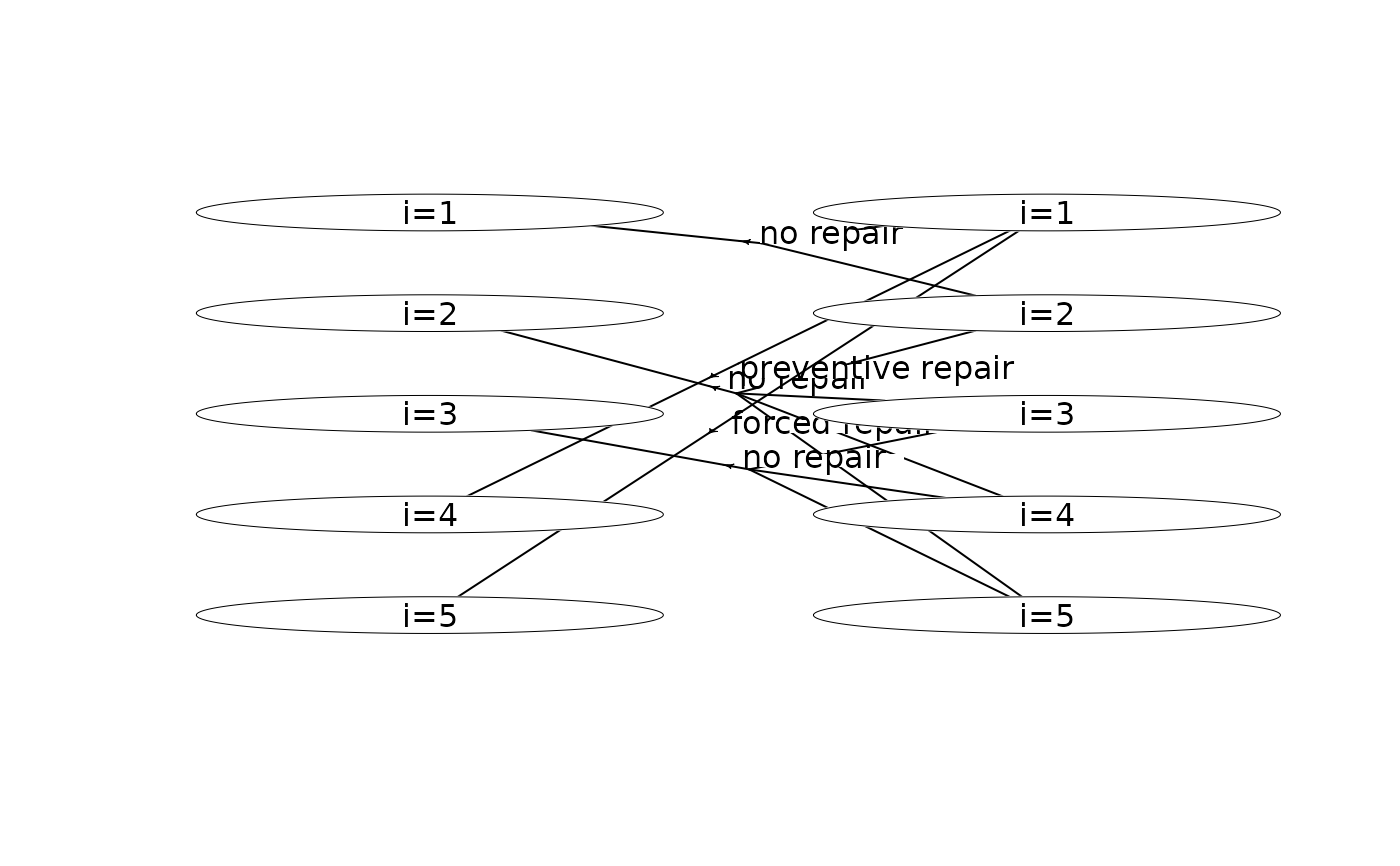
 plot(mdp, trans_labels = "state") # label transitions with target state labels
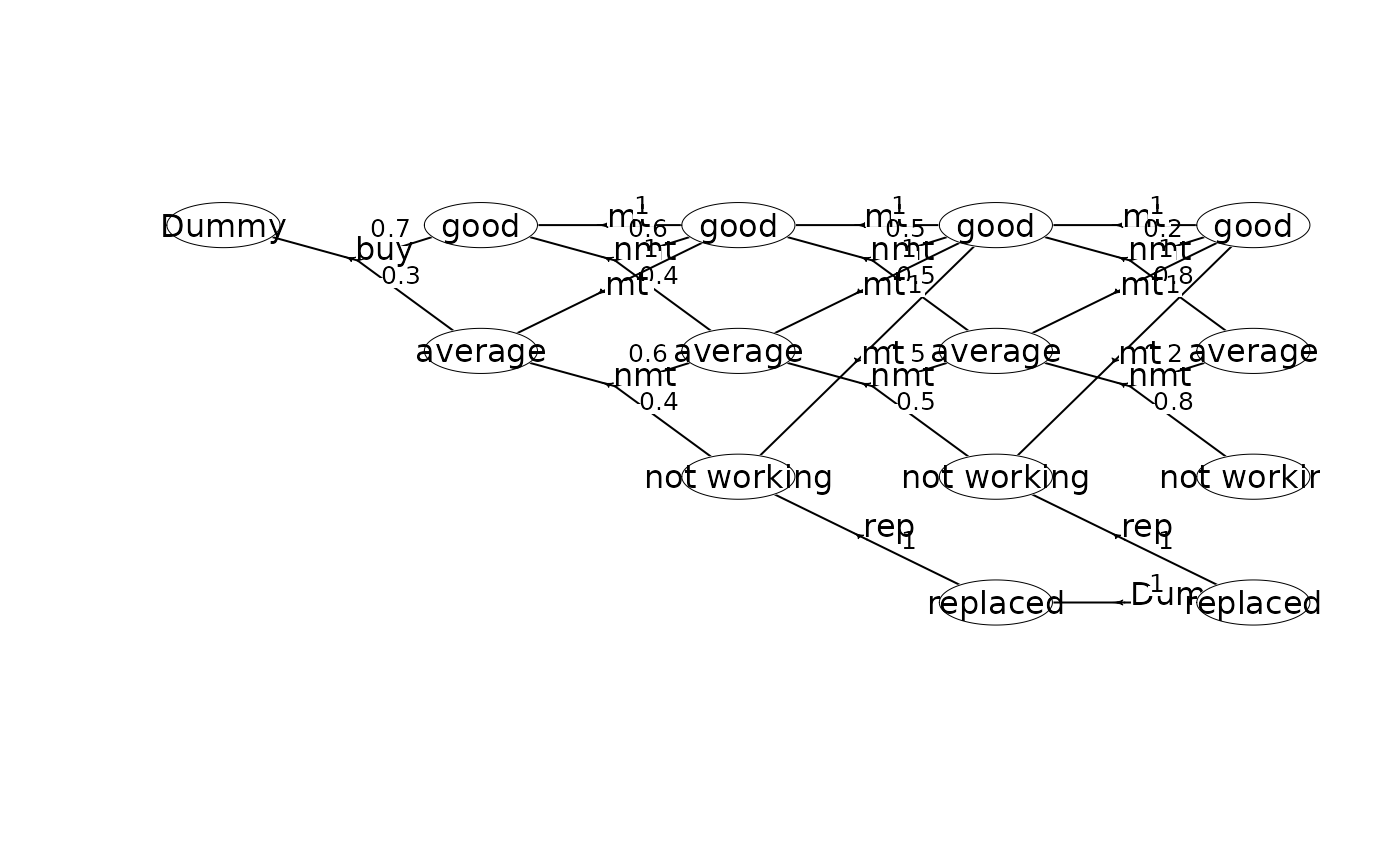
 plot(mdp, trans_labels = "prob") # label transitions with transition probabilities
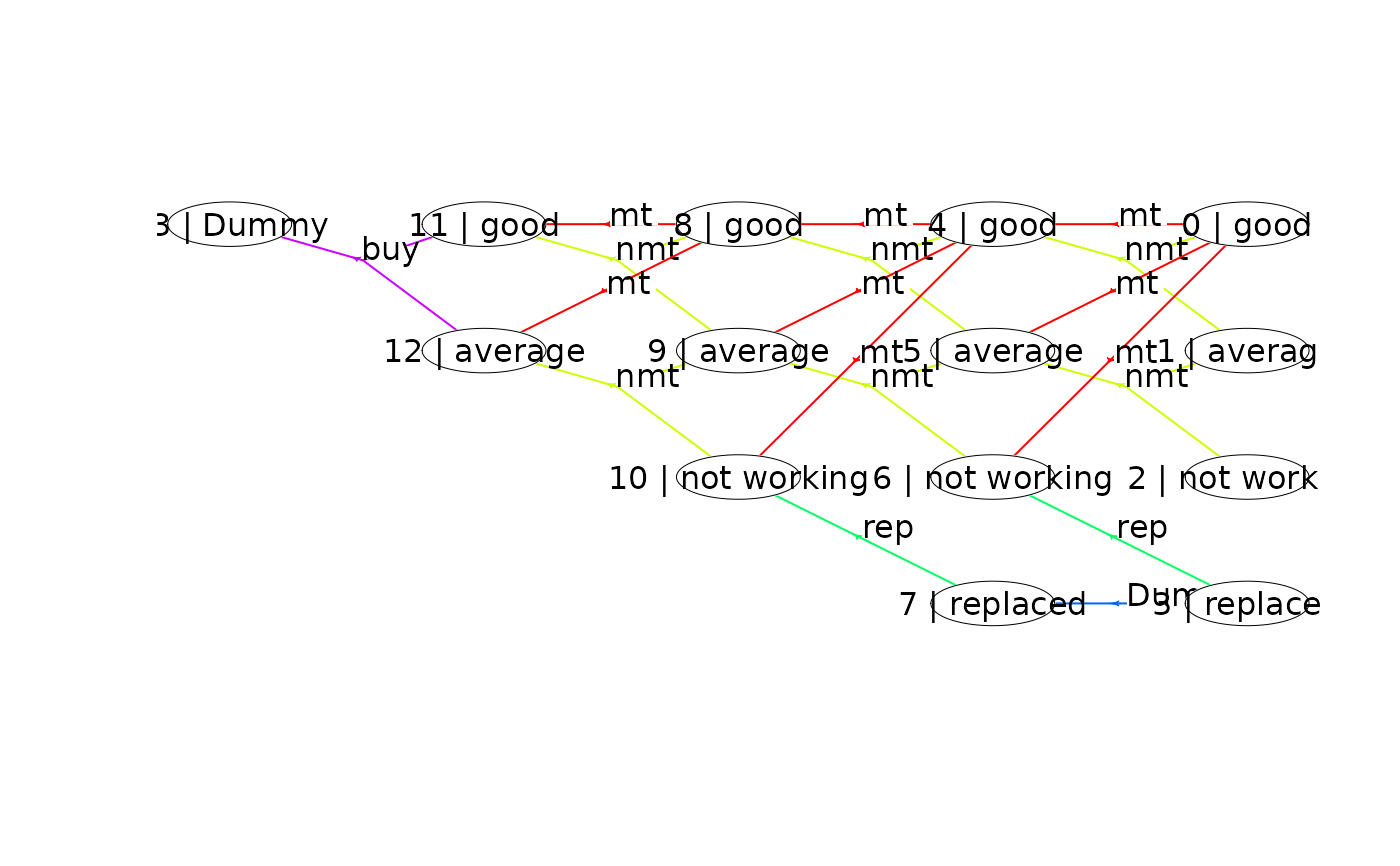
 plot(mdp, action_color = "label", state_label = "s_id|label") # state labels are 's_id | label'
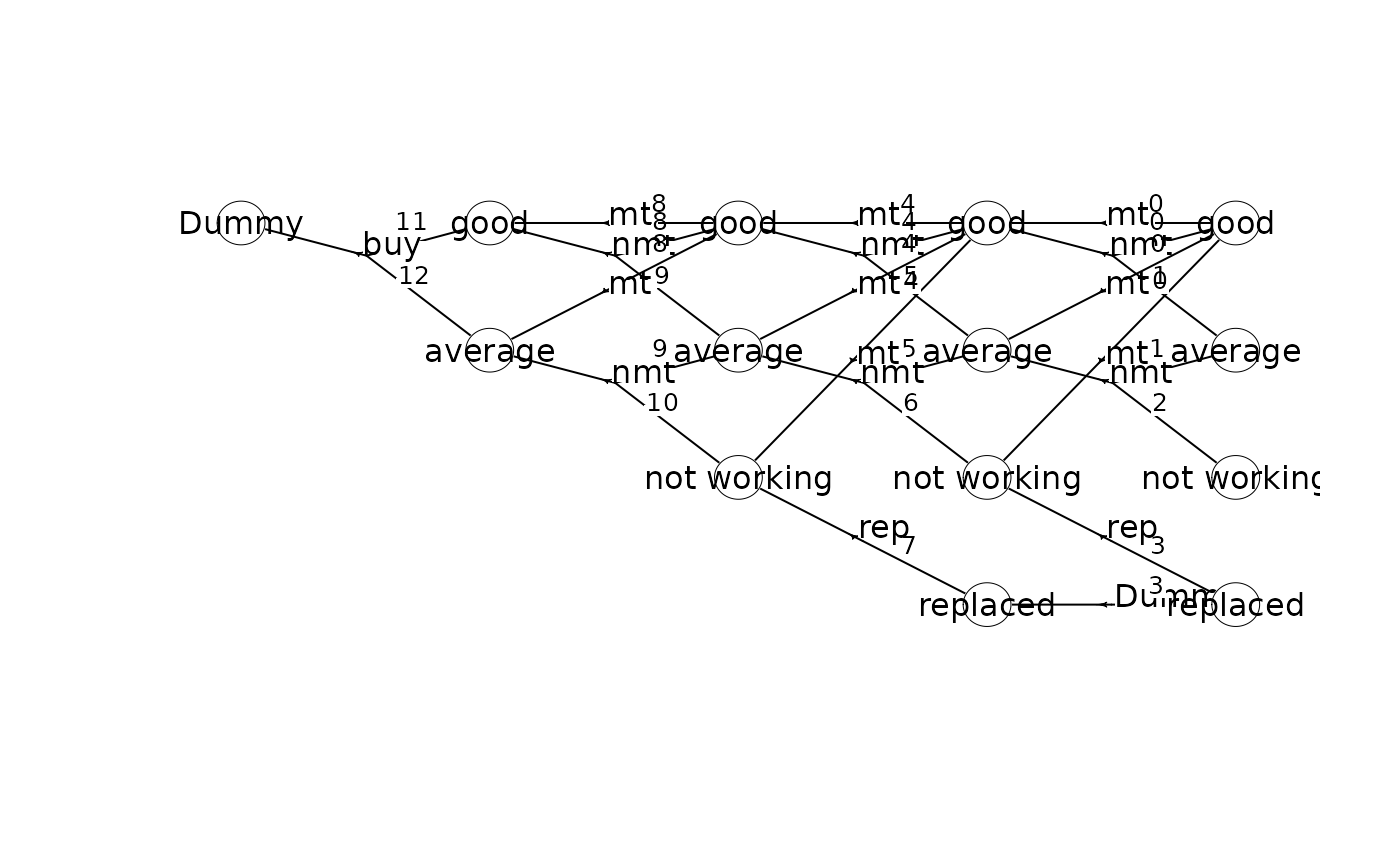
 plot(mdp, state_label = "s_idx|label", radx = 0.01) # adjust radx in states
 plot(mdp, state_label = "label", action_w_label = "none", action_label = "label",
trans_labels = "s_id", radx = 0.01)
plot(mdp, state_label = "label", action_w_label = "none", action_label = "label",
trans_labels = "s_id", radx = 0.01)
 scrapValues <- c(30, 10, 5, 0) # scrap values (the values of the 4 states at stage 4)
run_value_ite(mdp, "Net reward" , term_values = scrapValues)
#> Run value iteration with epsilon = 0 at most 1 time(s)
#> using weight 'Net reward' under expected-weight Bellman operator.
#> Finished. Cpu time 9.754e-06 sec.
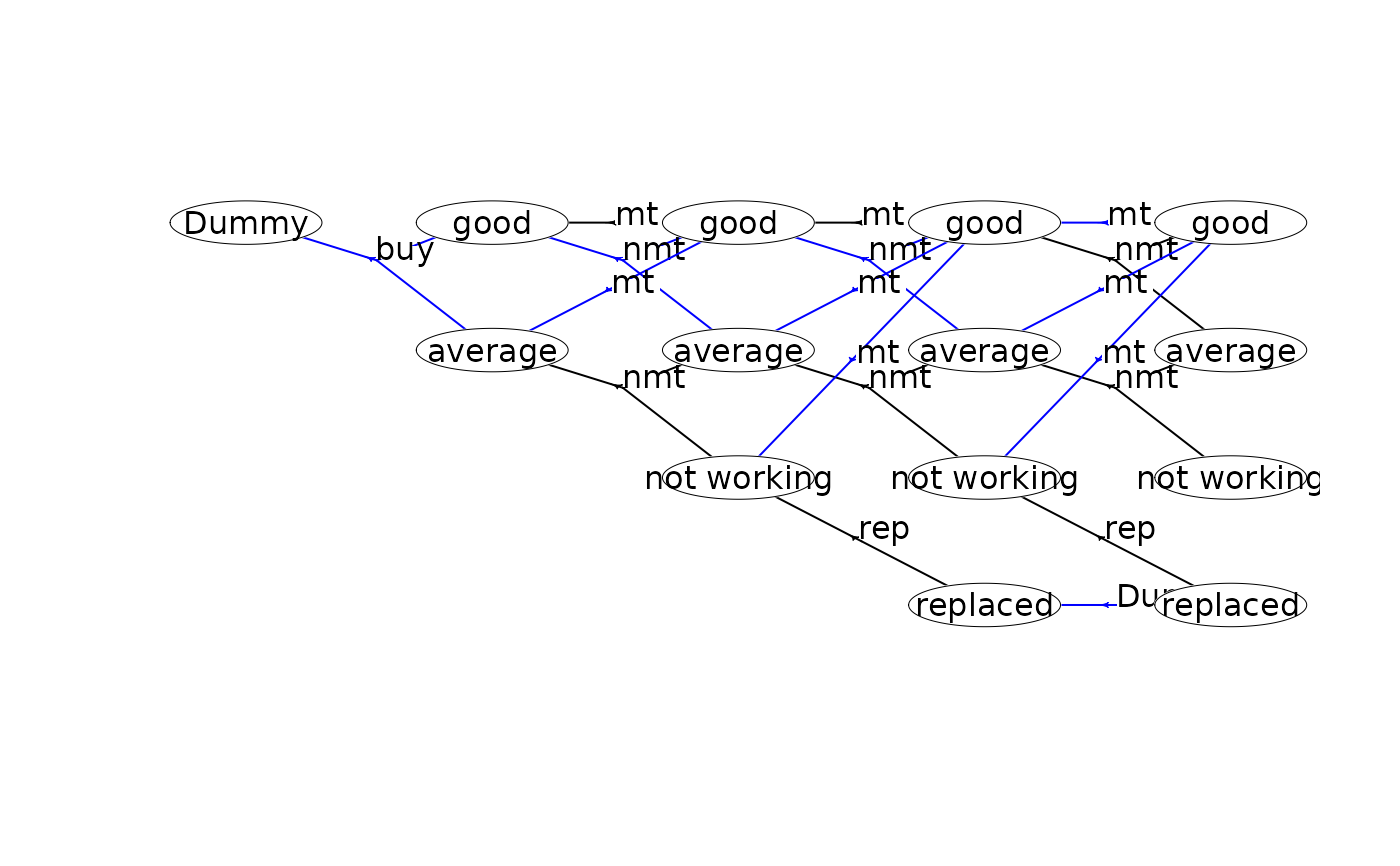
plot(mdp, action_color = "policy") # highlight optimal policy
scrapValues <- c(30, 10, 5, 0) # scrap values (the values of the 4 states at stage 4)
run_value_ite(mdp, "Net reward" , term_values = scrapValues)
#> Run value iteration with epsilon = 0 at most 1 time(s)
#> using weight 'Net reward' under expected-weight Bellman operator.
#> Finished. Cpu time 9.754e-06 sec.
plot(mdp, action_color = "policy") # highlight optimal policy
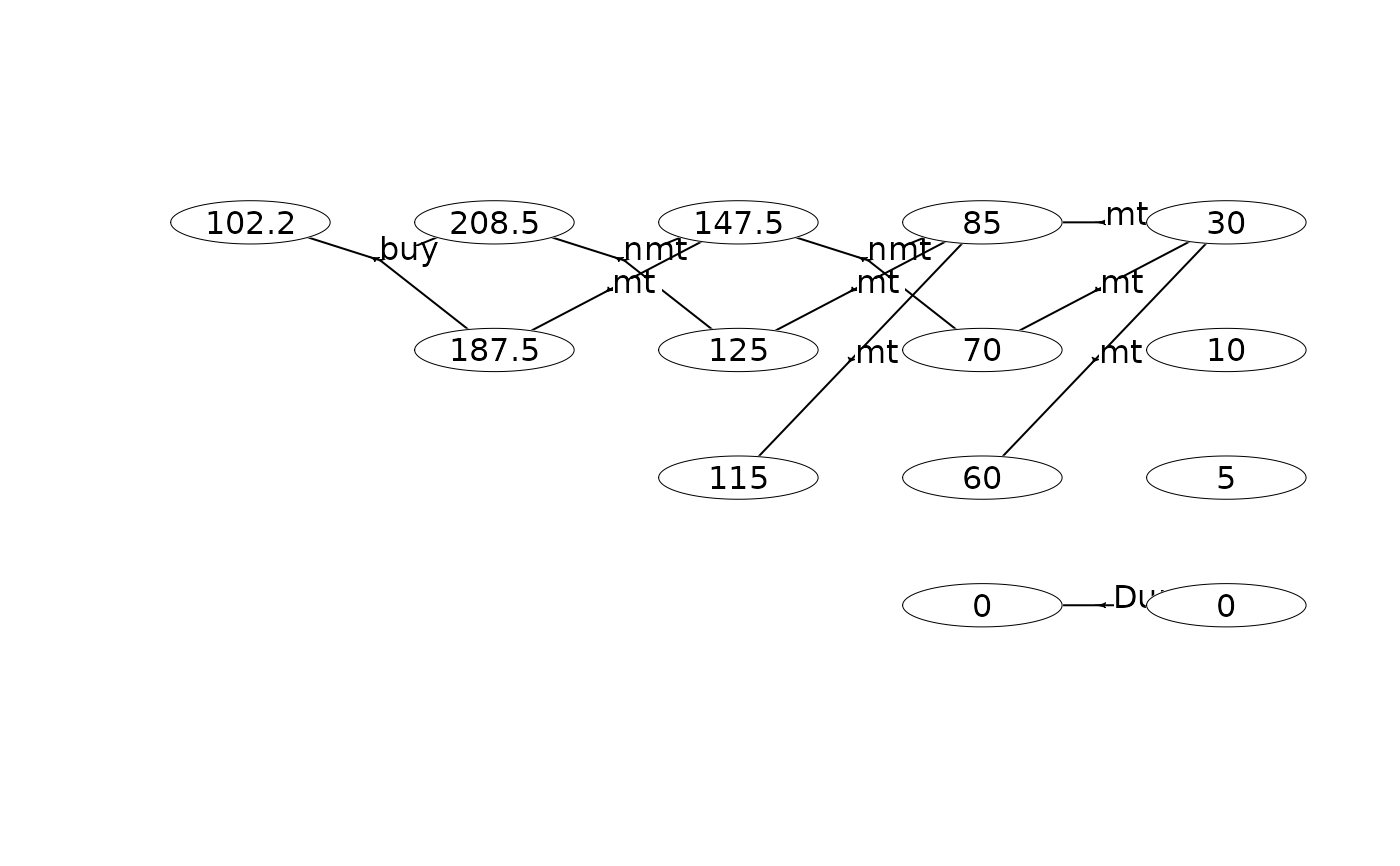
 plot(mdp, actions_visible = "policy", state_label = "weight") # show only optimal policy
 #### An infinite-horizon maintenance problem ####
mdp<-load_mdp("hct611-1_")
#> Read binary files (0.000134228 sec.)
#> Build the HMDP (3.2398e-05 sec.)
#> Checking MDP and found no errors (1.732e-06 sec.)
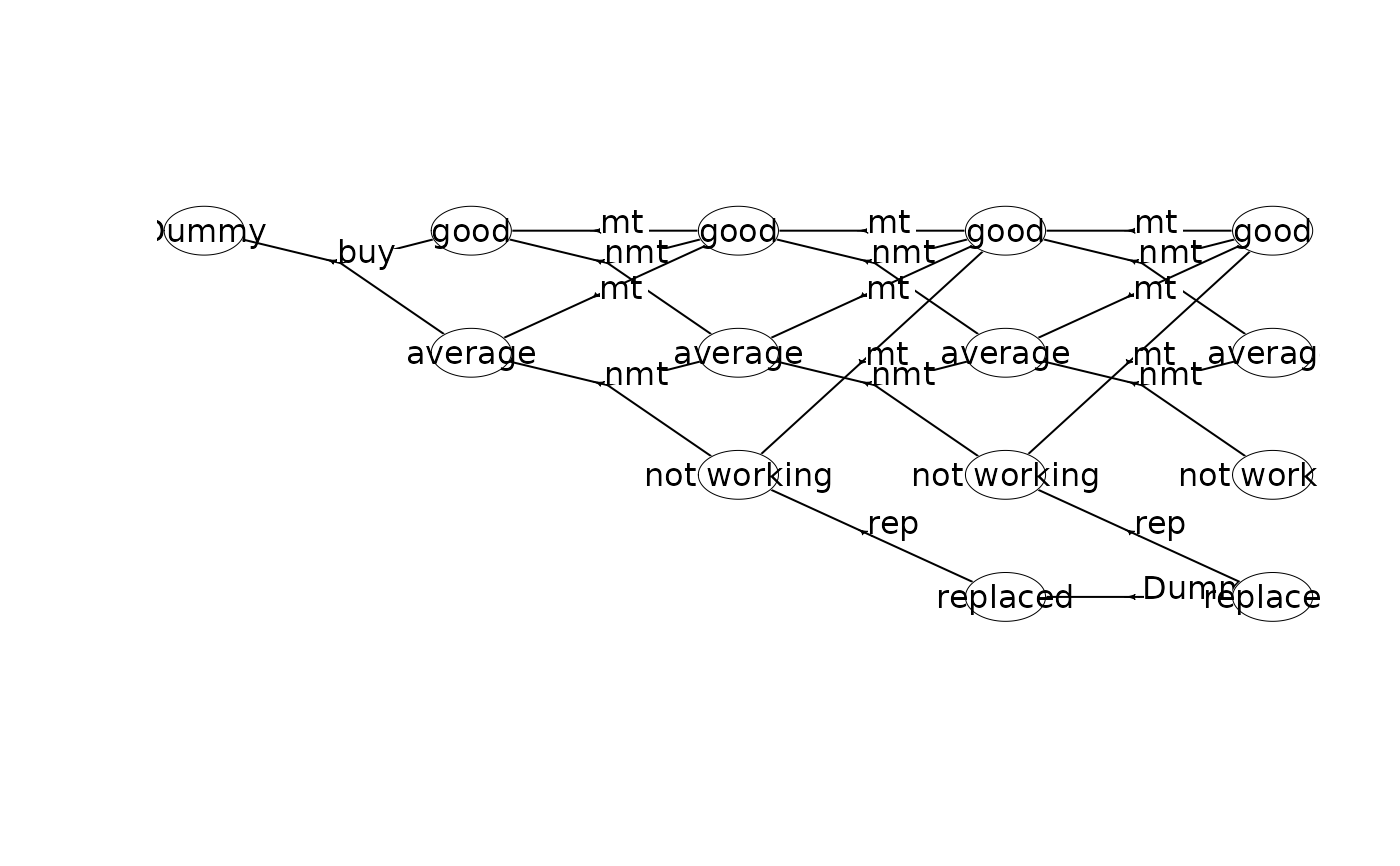
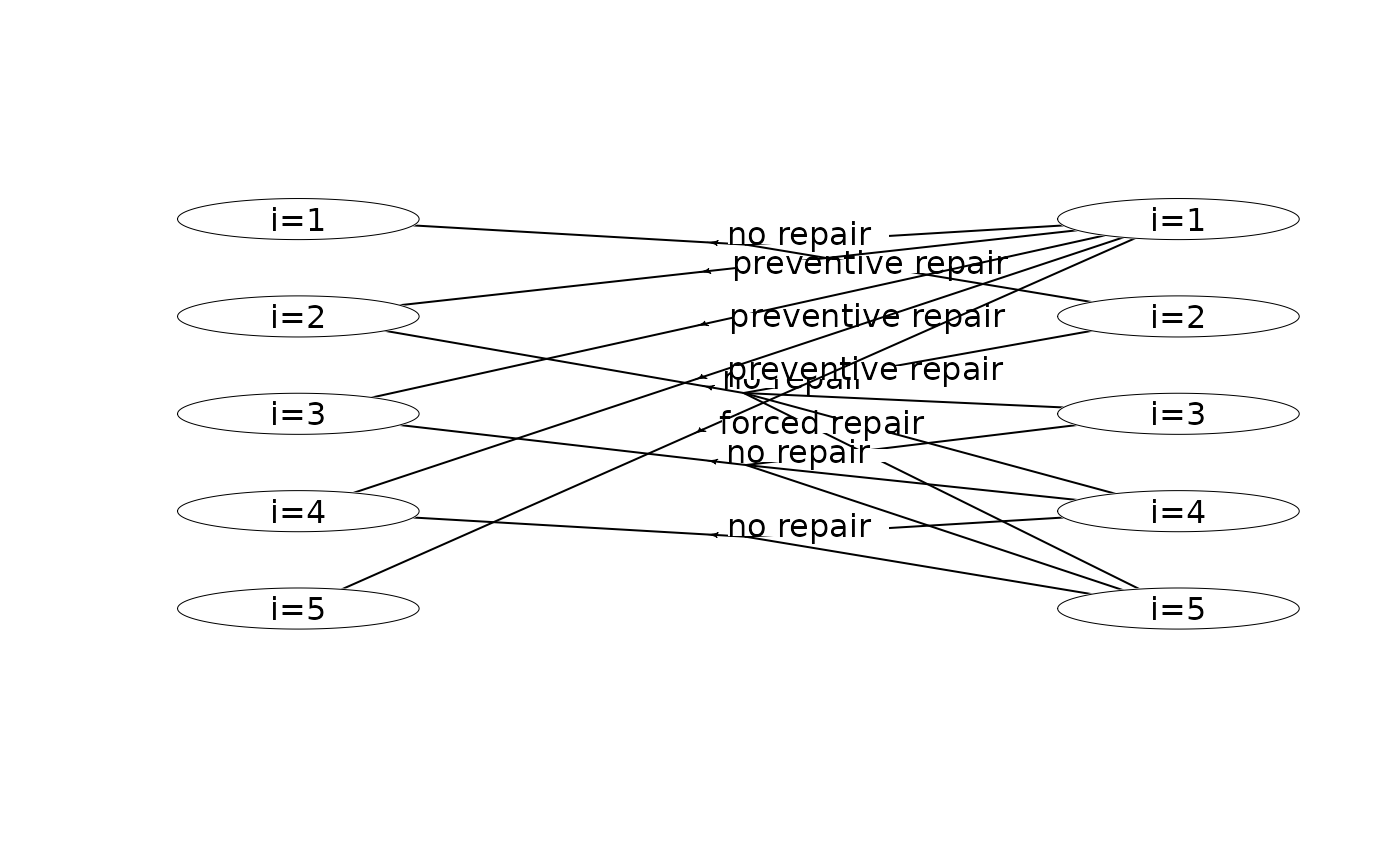
plot(mdp) # plot the first two stages
#### An infinite-horizon maintenance problem ####
mdp<-load_mdp("hct611-1_")
#> Read binary files (0.000134228 sec.)
#> Build the HMDP (3.2398e-05 sec.)
#> Checking MDP and found no errors (1.732e-06 sec.)
plot(mdp) # plot the first two stages
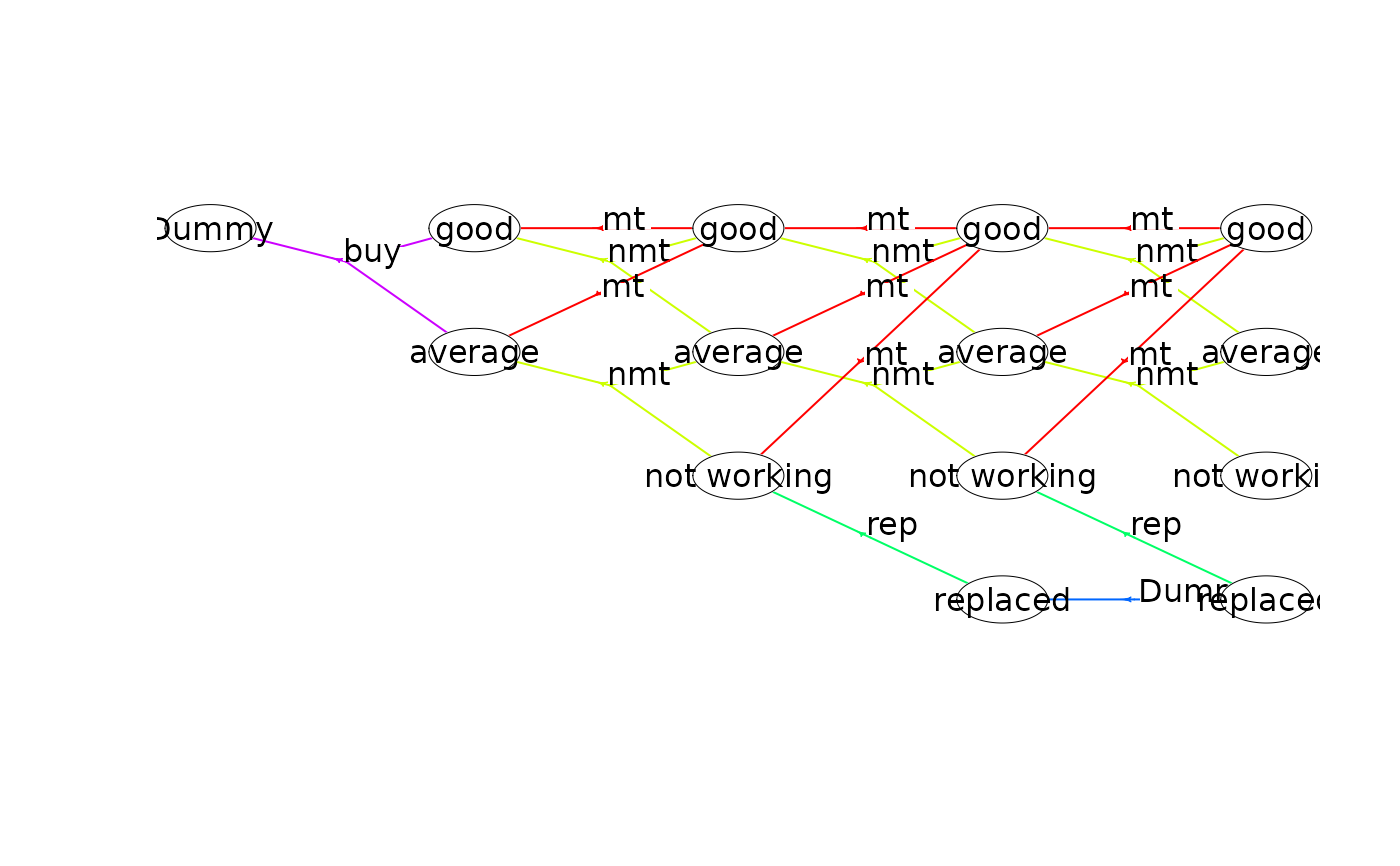
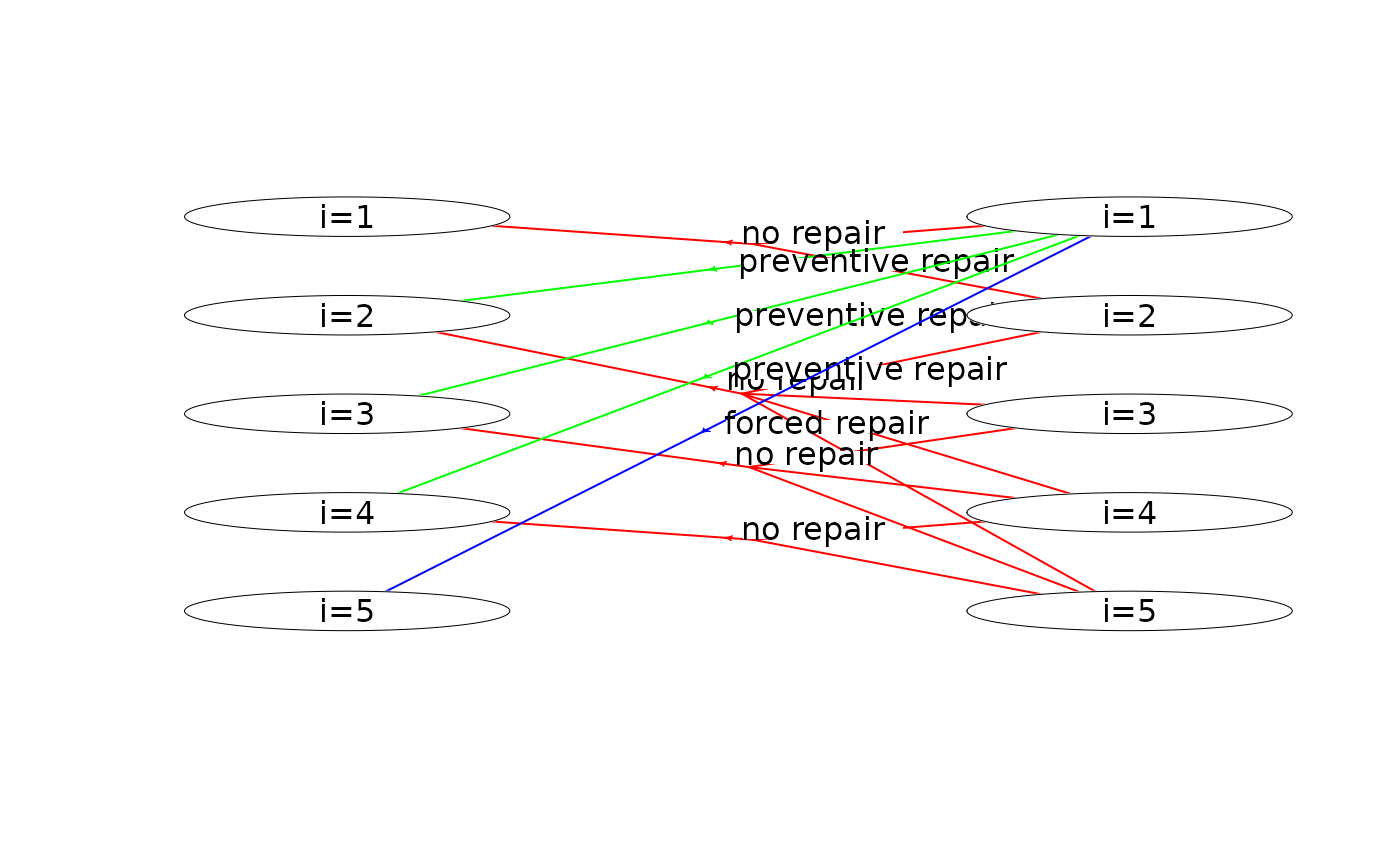
 plot(mdp, action_color = "label") # colors based on labels
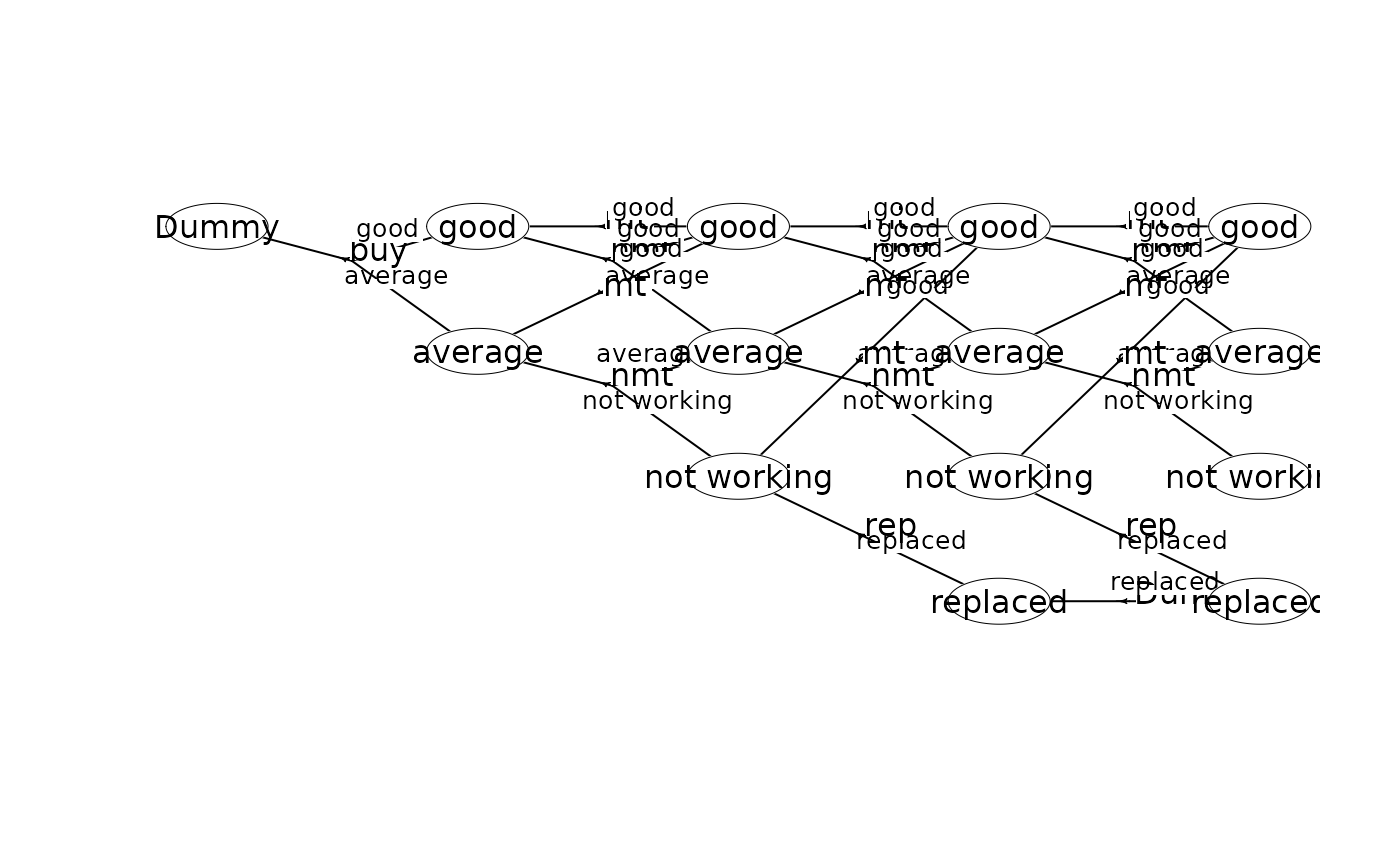
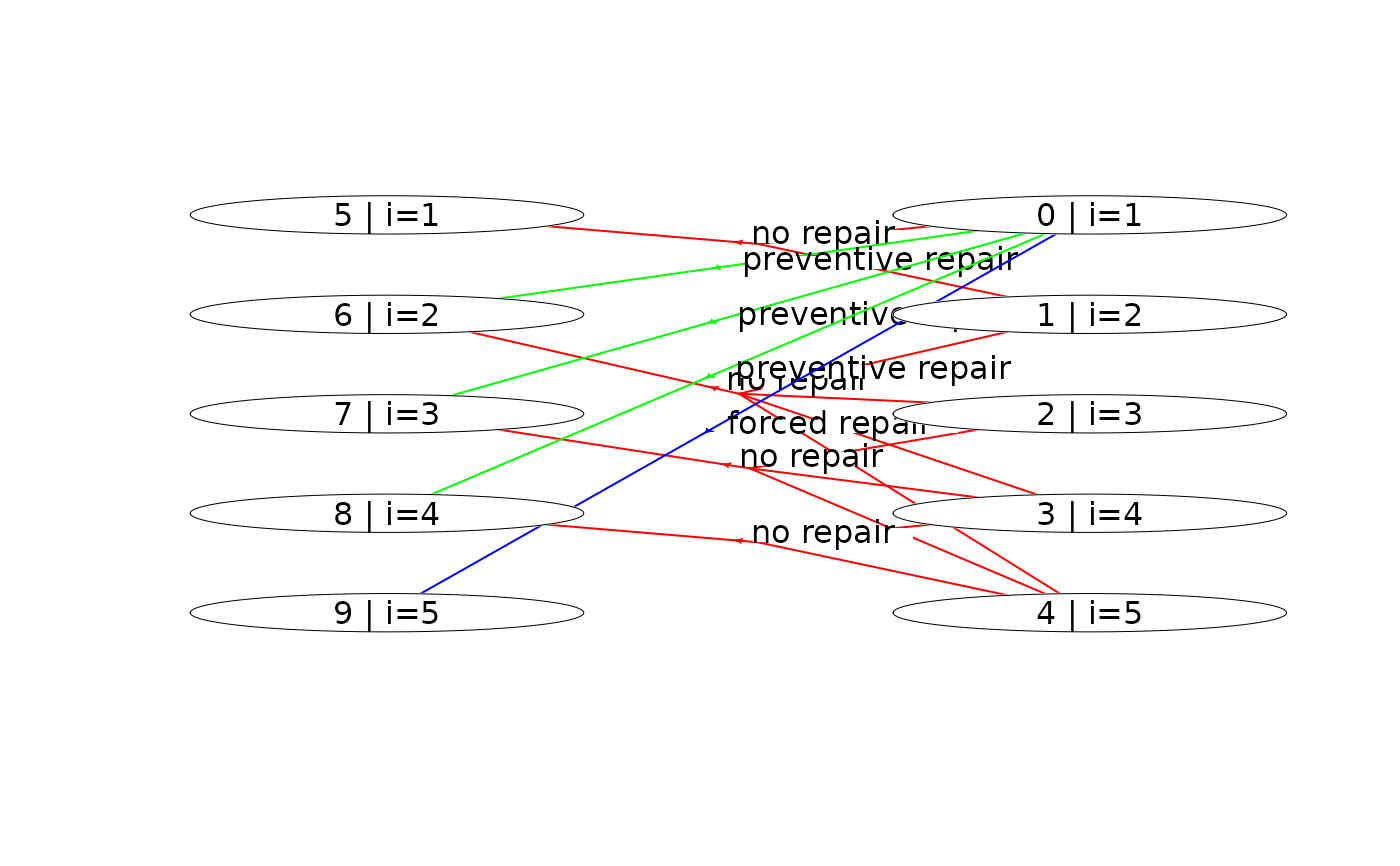
 plot(mdp, action_color = "label", state_label = "s_id|label") # state labels are 's_id | label'
 run_policy_ite_ave(mdp,"Net reward","Duration")
#> Run policy iteration under average expected-weight Bellman operator using
#> weight 'Net reward' over 'Duration'. Iterations (g):
#> 1 (-0.512821) 2 (-0.446154) 3 (-0.43379) 4 (-0.43379) finished. Cpu time: 1.732e-06 sec.
#> [1] -0.43379
plot(mdp, action_color = "policy") # highlight optimal policy
run_policy_ite_ave(mdp,"Net reward","Duration")
#> Run policy iteration under average expected-weight Bellman operator using
#> weight 'Net reward' over 'Duration'. Iterations (g):
#> 1 (-0.512821) 2 (-0.446154) 3 (-0.43379) 4 (-0.43379) finished. Cpu time: 1.732e-06 sec.
#> [1] -0.43379
plot(mdp, action_color = "policy") # highlight optimal policy
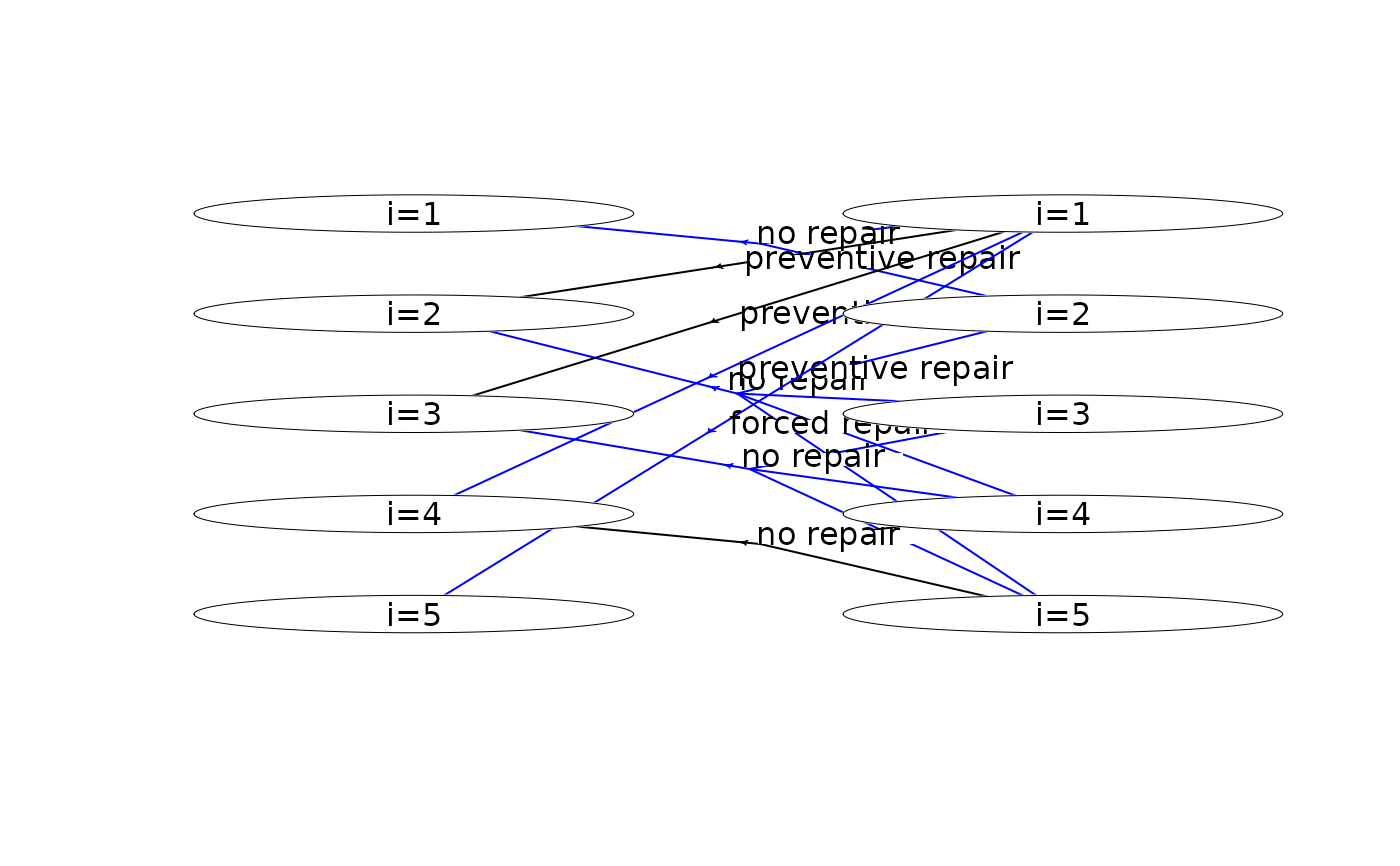 plot(mdp, actions_visible = "policy") # show only optimal policy
 #### An infinite-horizon hierarchical replacement problem ####
library(magrittr)
mdp<-load_mdp("cow_")
#> Read binary files (0.000316397 sec.)
#> Build the HMDP (0.000217131 sec.)
#> Checking MDP and found no errors (3.646e-06 sec.)
hgf <- get_hypergraph(mdp)
# modify labels
dat <- hgf$nodes %>%
dplyr::mutate(label = dplyr::case_when(
label == "Low yield" ~ "L",
label == "Avg yield" ~ "A",
label == "High yield" ~ "H",
label == "Dummy" ~ "D",
label == "Bad genetic level" ~ "Bad",
label == "Avg genetic level" ~ "Avg",
label == "Good genetic level" ~ "Good",
TRUE ~ "Error"
))
# assign nodes to grid ids
dat$g_id[1:3]<-85:87
dat$g_id[43:45]<-1:3
get_g_id<-function(process,stage,state) {
if (process==0) start=18
if (process==1) start=22
if (process==2) start=26
return(start + 14 * stage + state)
}
idx<-43
for (process in 0:2)
for (stage in 0:4)
for (state in 0:2) {
if (stage==0 & state>0) break
idx<-idx-1
#cat(idx,process,stage,state,get_g_id(process,stage,state),"\n")
dat$g_id[idx]<-get_g_id(process,stage,state)
}
hgf$nodes <- dat
# modify labels
dat <- hgf$hyperarcs %>%
dplyr::mutate(label = dplyr::case_when(
label == "Replace" ~ "R",
label == "Keep" ~ "K",
label == "Dummy" ~ "D",
TRUE ~ "Error"
),
col = dplyr::case_when(
label == "R" ~ "deepskyblue3",
label == "K" ~ "darkorange1",
label == "D" ~ "black",
TRUE ~ "Error"
),
lwd = 0.5,
label = ""
)
hgf$hyperarcs <- dat
# plot hypergraph
oldpar <- par(mai = c(0, 0, 0, 0))
plot_hypergraph(grid_dim = c(14, 7), hgf, cex = 0.8, radx = 0.02, rady = 0.03)
#### An infinite-horizon hierarchical replacement problem ####
library(magrittr)
mdp<-load_mdp("cow_")
#> Read binary files (0.000316397 sec.)
#> Build the HMDP (0.000217131 sec.)
#> Checking MDP and found no errors (3.646e-06 sec.)
hgf <- get_hypergraph(mdp)
# modify labels
dat <- hgf$nodes %>%
dplyr::mutate(label = dplyr::case_when(
label == "Low yield" ~ "L",
label == "Avg yield" ~ "A",
label == "High yield" ~ "H",
label == "Dummy" ~ "D",
label == "Bad genetic level" ~ "Bad",
label == "Avg genetic level" ~ "Avg",
label == "Good genetic level" ~ "Good",
TRUE ~ "Error"
))
# assign nodes to grid ids
dat$g_id[1:3]<-85:87
dat$g_id[43:45]<-1:3
get_g_id<-function(process,stage,state) {
if (process==0) start=18
if (process==1) start=22
if (process==2) start=26
return(start + 14 * stage + state)
}
idx<-43
for (process in 0:2)
for (stage in 0:4)
for (state in 0:2) {
if (stage==0 & state>0) break
idx<-idx-1
#cat(idx,process,stage,state,get_g_id(process,stage,state),"\n")
dat$g_id[idx]<-get_g_id(process,stage,state)
}
hgf$nodes <- dat
# modify labels
dat <- hgf$hyperarcs %>%
dplyr::mutate(label = dplyr::case_when(
label == "Replace" ~ "R",
label == "Keep" ~ "K",
label == "Dummy" ~ "D",
TRUE ~ "Error"
),
col = dplyr::case_when(
label == "R" ~ "deepskyblue3",
label == "K" ~ "darkorange1",
label == "D" ~ "black",
TRUE ~ "Error"
),
lwd = 0.5,
label = ""
)
hgf$hyperarcs <- dat
# plot hypergraph
oldpar <- par(mai = c(0, 0, 0, 0))
plot_hypergraph(grid_dim = c(14, 7), hgf, cex = 0.8, radx = 0.02, rady = 0.03)
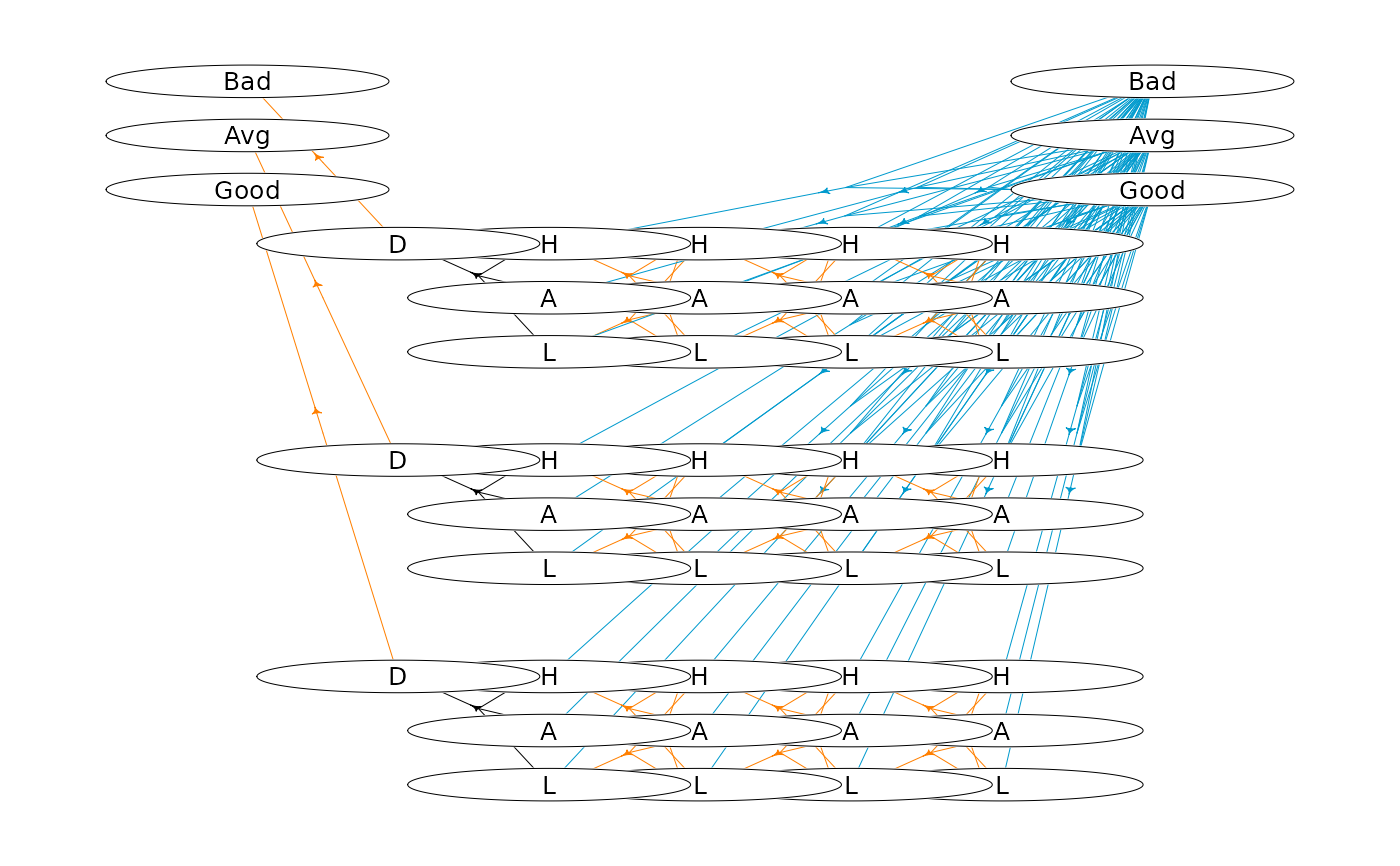 par(oldpar)
## A simple finite-horizon MDP with action and transition weights
prefix <- file.path(tempdir(), "plot_transition_rewards_")
w <- binary_mdp_writer(prefix)
w$set_weights("Cost")
w$set_trans_weights(c("Reward", "Disease"))
w$process()
w$stage()
w$state(label = "S1")
w$action(
label = "A1", weights = 2, id = c(1), pr = c(1),
trans_weights = c(20, 0.3), end = TRUE
)
w$action(
label = "A2", weights = 1, id = c(0, 1), pr = c(0.3, 0.7),
trans_weights = c(25, 0.4, 15, 0.2), end = TRUE
)
w$end_state()
w$end_stage()
w$stage()
w$state(label = "S2")
w$action(
label = "A3", weights = 3, id = c(0, 1, 2), pr = c(0.5, 0.3, 0.2),
trans_weights = c(0, 0.05, 12, 0.2, 30, 0.8), end = TRUE
)
w$action(
label = "A4", weights = 2, id = c(1, 2), pr = c(0.6, 0.4),
trans_weights = c(22, 0.35, 27, 0.7), end = TRUE
)
w$end_state()
w$state(label = "S3")
w$action(
label = "A5", weights = 1, id = c(0, 1), pr = c(0.4, 0.6),
trans_weights = c(5, 0, 16, 0.25), end = TRUE
)
w$action(
label = "A6", weights = 4, id = c(0, 1, 2), pr = c(0.1, 0.3, 0.6),
trans_weights = c(14, 0.15, 21, 0.45, 29, 1), end = TRUE
)
w$end_state()
w$end_stage()
w$stage()
w$state(label = "S4", end = TRUE)
w$state(label = "S5", end = TRUE)
w$state(label = "S6", end = TRUE)
w$end_stage()
w$end_process()
w$close_writer()
#>
#> Statistics:
#> states : 6
#> actions: 6
#> weights: 1
#>
#> Closing binary MDP writer.
#>
mdp <- load_mdp(prefix, get_log = FALSE)
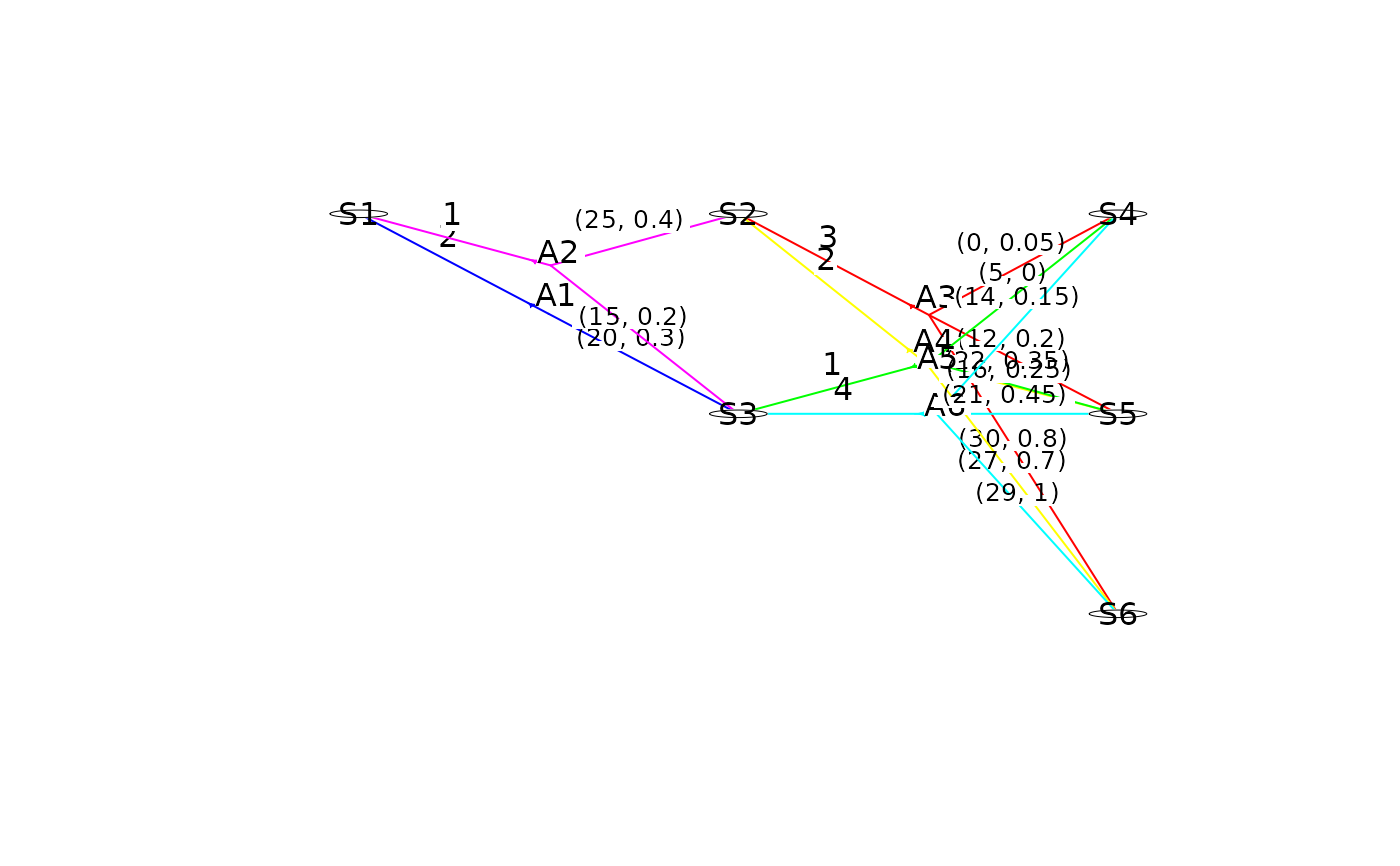
plot(mdp, action_color = "label", trans_labels = "weights", action_w_label = "weight",
radx = 0.005, rady = 0.01)
par(oldpar)
## A simple finite-horizon MDP with action and transition weights
prefix <- file.path(tempdir(), "plot_transition_rewards_")
w <- binary_mdp_writer(prefix)
w$set_weights("Cost")
w$set_trans_weights(c("Reward", "Disease"))
w$process()
w$stage()
w$state(label = "S1")
w$action(
label = "A1", weights = 2, id = c(1), pr = c(1),
trans_weights = c(20, 0.3), end = TRUE
)
w$action(
label = "A2", weights = 1, id = c(0, 1), pr = c(0.3, 0.7),
trans_weights = c(25, 0.4, 15, 0.2), end = TRUE
)
w$end_state()
w$end_stage()
w$stage()
w$state(label = "S2")
w$action(
label = "A3", weights = 3, id = c(0, 1, 2), pr = c(0.5, 0.3, 0.2),
trans_weights = c(0, 0.05, 12, 0.2, 30, 0.8), end = TRUE
)
w$action(
label = "A4", weights = 2, id = c(1, 2), pr = c(0.6, 0.4),
trans_weights = c(22, 0.35, 27, 0.7), end = TRUE
)
w$end_state()
w$state(label = "S3")
w$action(
label = "A5", weights = 1, id = c(0, 1), pr = c(0.4, 0.6),
trans_weights = c(5, 0, 16, 0.25), end = TRUE
)
w$action(
label = "A6", weights = 4, id = c(0, 1, 2), pr = c(0.1, 0.3, 0.6),
trans_weights = c(14, 0.15, 21, 0.45, 29, 1), end = TRUE
)
w$end_state()
w$end_stage()
w$stage()
w$state(label = "S4", end = TRUE)
w$state(label = "S5", end = TRUE)
w$state(label = "S6", end = TRUE)
w$end_stage()
w$end_process()
w$close_writer()
#>
#> Statistics:
#> states : 6
#> actions: 6
#> weights: 1
#>
#> Closing binary MDP writer.
#>
mdp <- load_mdp(prefix, get_log = FALSE)
plot(mdp, action_color = "label", trans_labels = "weights", action_w_label = "weight",
radx = 0.005, rady = 0.01)
 ## Reset working dir
setwd(wd)
## Reset working dir
setwd(wd)